reading-notes
Course 201, Entry 12: Chart.js, Canvas
Graphics and charts offer a lot of value for a page. Via Canvas and Chart.js, pages can be amplified in their delivery.
JavaScript Canvas
With Canvas, a developer can add 2D graphics. This is initiated by creating a <canvas> tag, with width and height attributes therein. These can later be changed via the following syntax:
const canvas = document.querySelector('#canvas');

canvas.width = 600;
canvas.height = 400;
Unlike image elements, the canvas element needs a closing tag. This is because within the tags is fallback content.
getContext() method
The getContext() method takes just one argument, the context type. An example of pulling the 2D context method is as follows:
let canvas = document.querySelector('#canvas');
let ctx = main.getContext('2d');
2D Drawing Context
The 2D drawing context has two main options, fillStyle and strokeStyle. These are completed using the VI quadrant for an X and Y axis coordinate.
Example:
(() => {
    const canvas = document.querySelector('#main');
    if (!canvas.getContext) {
        return;
    }

    // get the context
    let ctx = canvas.getContext('2d');

    // set fill and stroke styles
    ctx.fillStyle = '#F0DB4F';
    ctx.strokeStyle = 'red';

    // draw a rectangle with fill and stroke
    ctx.fillRect(50, 50, 150, 100);
    ctx.strokeRect(50, 50, 150, 100);

})();
Output:
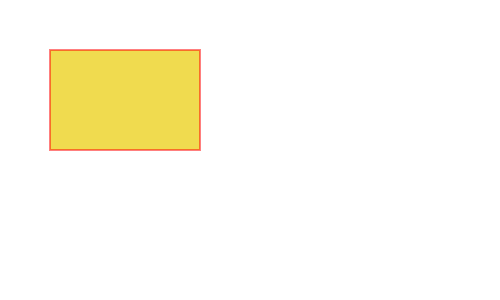
The first two numbers in each parameter represent where to start, while the last two numbers represent the width and height.
Chart.js
Charts.js is an opensouce library for charts. It offers the ability to make highly customized charts with a large number of chart types and plugins available. In addition, it has animations. Charts.js is highly integrated, being compatible with the frameworks such as Vue, React, Svelte, and Angular.
Rendering can be done to HTML5, however, CSS is not supported natively.
Chart types:
- Bar Chart
- Bubble Chart
- Doughnut and Pie Charts
- Line Chart
- Mixed Chart Types
- Polar Area Chart
- Radar Chart
- Scatter Chart
Charts have some clear advantages. They are clean and easier to interpret than a table. But they are more difficult to build.
To aid me in my previous creation, a chart can be added to the Odd Duck Products lab. This will create a nice visualization of the percentage distribution.
Things I want to know more about
The use cases for using charts.js.